Here you can find easy step by step process how to set transfer function in f3dvr.
Transfer function editor
Menu
File
Read from file - load transfer function form a file.
Save to file - save transfer function to the file.
Exit - close the transfer function editor.
Reset
Reset all - reset all curves to initial values.
Reset selected - reset only selected curves to initial values.
Classification
pre classification - sets rendering by pre classification algorithms.
post classification - sets rendering by post classification algorithms.
Pre-integrated classification - sets rendering by pre-integrated classification algorithms.
Show
Show function - shows transfer functions in the window.
show grid - shows grid in the window.
show palette - shows palette in the window.
show hull - shows hull for bezier curve type in the window.
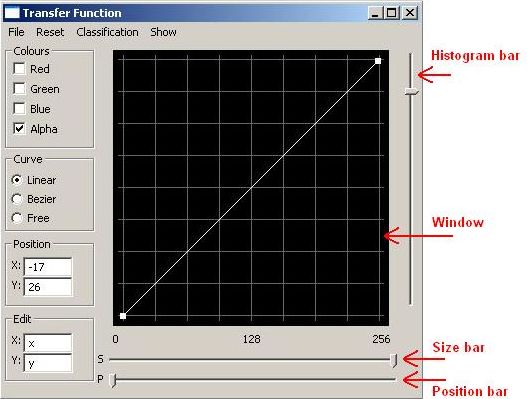
Editor
Window - area where curves and other stuff is displayed.
Size bar - zoom in/out displayed curves in the window.
Position bar - position of displayed curves.
Histogram bar - scaling of the histogram displayed in the window.
Position - mouse position on the editor window.
Edit - actual coordinates of curve control points. If control point has been selected, the curve type (0-red, 1-green, 2-blue, 3-alpha) and control point number is displayed.
Curve - 3 types of displayed curves. Linear - linear interpolation between control points. Bezier - bezier curve defined by control points. Free - curve defined by each point in window (free hand drawing).
Colours - enabling/disabling manipulation of the belonging curve (control points). If check box is checked it is possible to manipulate by corresponding curve. If more curves are checked manipulation is done on all checked curves.
Curve manipulation
All this operation are done only if corresponding curves are checked.
You can add control point by left mouse click in the window. If you click (left)) on the control point, it is set as actual (Edit settings are changed by this control point). You can delete control point by right mouse click on the control point. If you left click down on the control point and moving with its, you can defining new control point position.
Transfer function definition
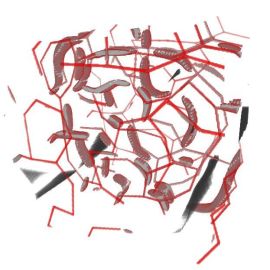
If you want to design transfer function it is desired to known something about dataset. Its structure or modality which was created by.
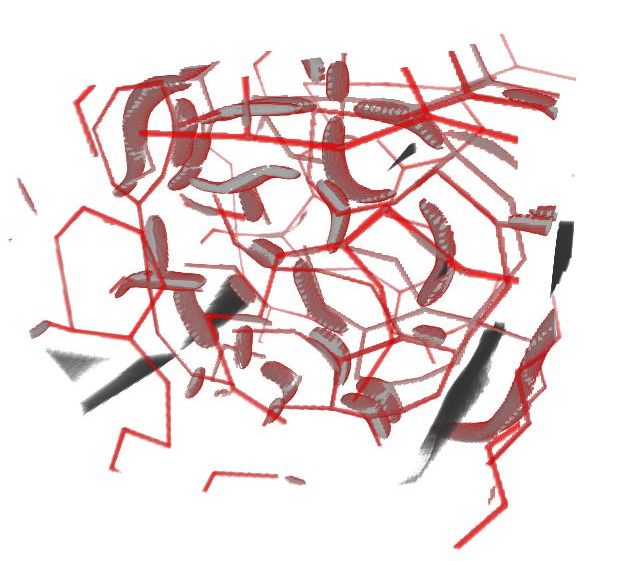
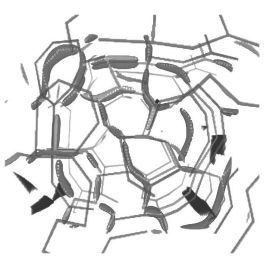
In our example we load muscle cell model which was created by artificialy. In the dataset are 4 types of organelles. Each type is defined on its own interval of scalar values. These intervals are disjunctive and their intervals are: type0 - <10,50>, type1 - <60,110>, type2 - <120,160>, type3 - <170,210>. We have generated some test palettes for muscle cell model.
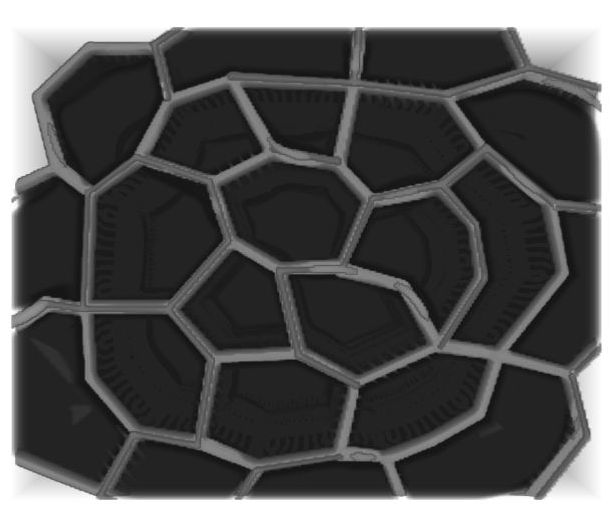
1, Load data set and use default transfer function. Set pre-integrated classification and linear filtering.

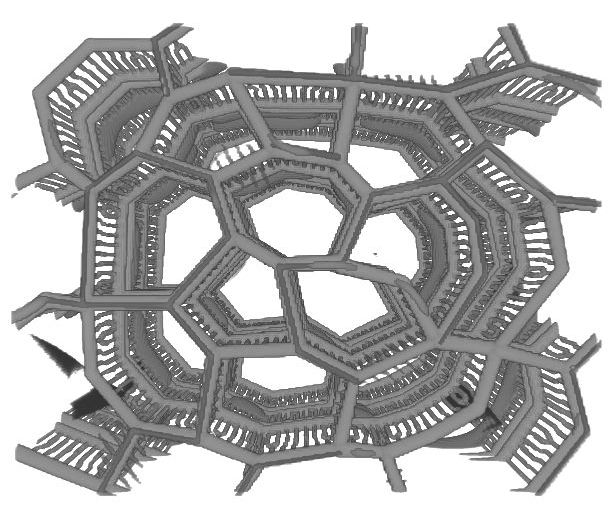
2, If we want to suppress displaying organelle of type0 it is necessary to set the alpha curve appropriate to these request. Alpha values from interval <0,49> have to be set to 0 (transparent).

3, If we want to suppress displaying organelle of type3 it is necessary to set values form interval <169,255> to 0.

4, In the standard rendering modes some artefacts are visible due to linear interpolation. It is possible to use nearest filtering or iso mode from setting menu to reduce this artefacts.
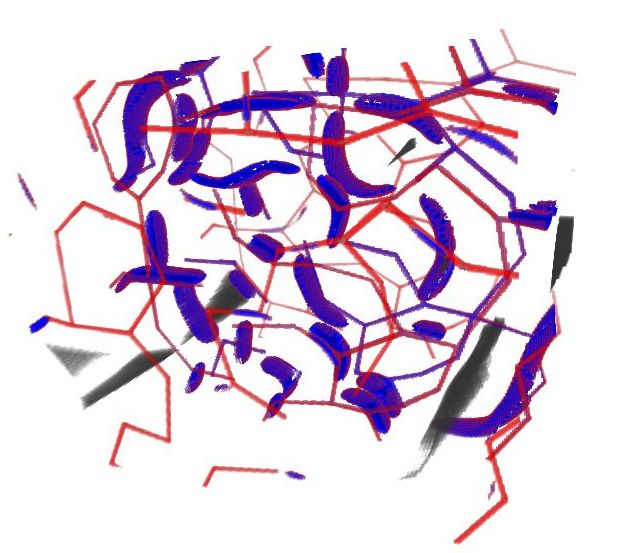
5, If we want to display organelle of type1 by red colour, it is necessary to set red curve to higher values (more opaque) in interval <59,111> and eventually set blue and green curve to 0 in same interval.

6, For organelle type2 we can set blue colour. Set blue curve in interval <119,161> to highier values and red, green curves to 0.

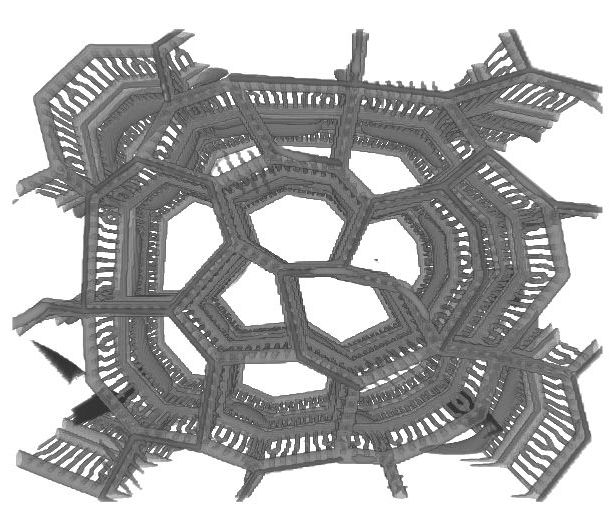
Different viewing angle