
Theses
I often supervise theses for students aiming for the MSc. or BSc. degrees. If you are a student looking for a thesis in the area of visualization or computer graphics, contact me.
This page is a showcase of some of the theses I supervised and their gifted authors I had the pleasure to work with.
Master students
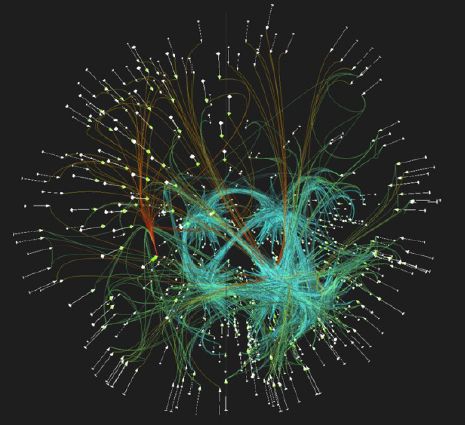
Spatial Visualization of Graph Structures (Ľubomír Lábaj)
We used sphere surface for a force-directed layout of trees and networks. The resulting visualization has better options for layout than simple 2D but is still readable compared to other similar 3D approaches. Ľubomír also created a novel and fast edge bundling algorithm to further improve the display.
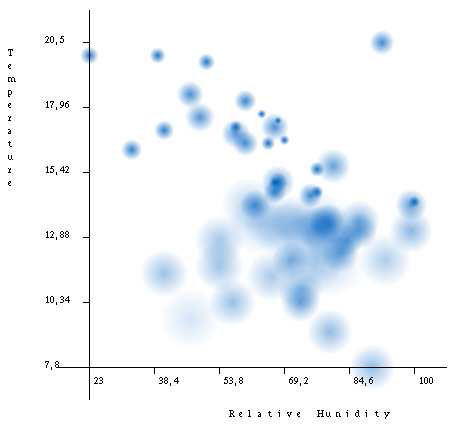
Time-dependent Scatterplots (Michal Miškovský)
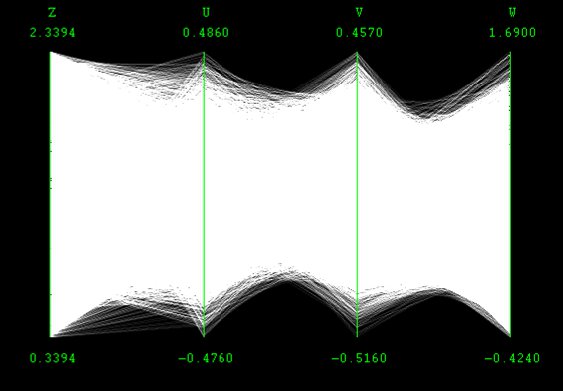
Scatterplot is a very useful and popular visualization technique for two-dimensional data. In this work we designed several new methods to incorporate the temporal aspect of the data into the visualization.
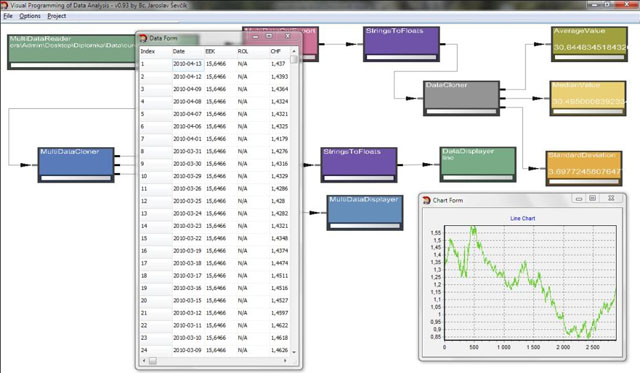
Visual Programming of Data Analysis (Jaroslav Ševčík)
Visual programming is a paradigm for creating programs not by writing syntax but by laying out and connecting separate program modules. We used this paradigm for creating, storing and presenting an analytic session over multidimensional data.
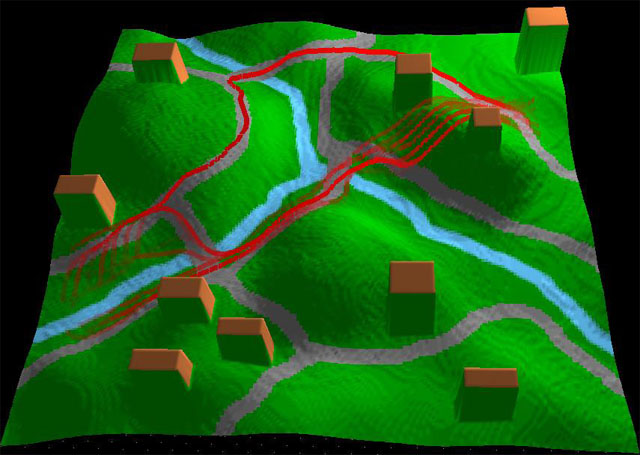
Simulation and Visualization of Pedestrian Movement in Urban Environment (Mária Kováčová)
Mária modified several pathfinding algorithms to consider variable terrain properties in an urban environment - sidewalks, bridges, slope. Plus she managed to parameterize human preferences and address issues with collisions and pedestrians density.
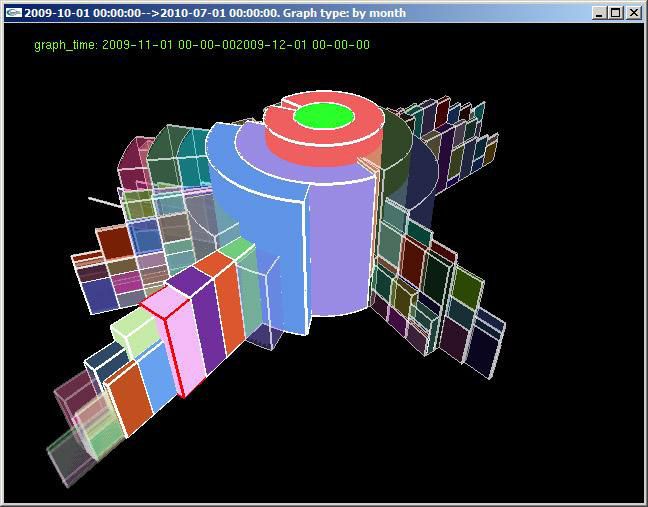
Visual Analysis of Load on Trees and Hierarchies (Ján Jalčovík)
The hierarchical data is often accompanied by parameters of the individual nodes in the hierarchy, e.g. number of accesses to a directory in a file system. Our interactive visualization employs a 3D extension of a treering with focus+context visualization.
Structure of Internet Discussion and its Visualization (Pavol Fabo)
An intuitive extension of the popular tag cloud visualization was designed and implemented by Pavol, who managed to create an interactive visualization with three levels of information (overall discussion dynamics over time, development of topics over time, distribution of keyword in a particular timestep.)
This thesis made it into a paper at the Information Visualization conference.
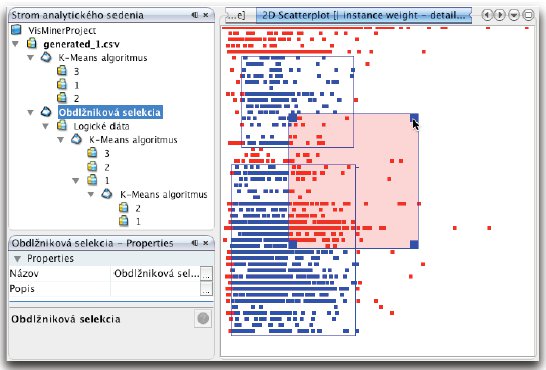
Combination of Automatic and Visual Data Mining Methods (Tomáš Poláček)
While both the visual and the automatic data mining methods have their undeniable benefits, it is through their combination that we synergize their effects and start to understand even really complicated data. In this work we attempt to organize the analytic process, steer the automatic methods, refine the parameters and present the overall process in a visually understandable manner.
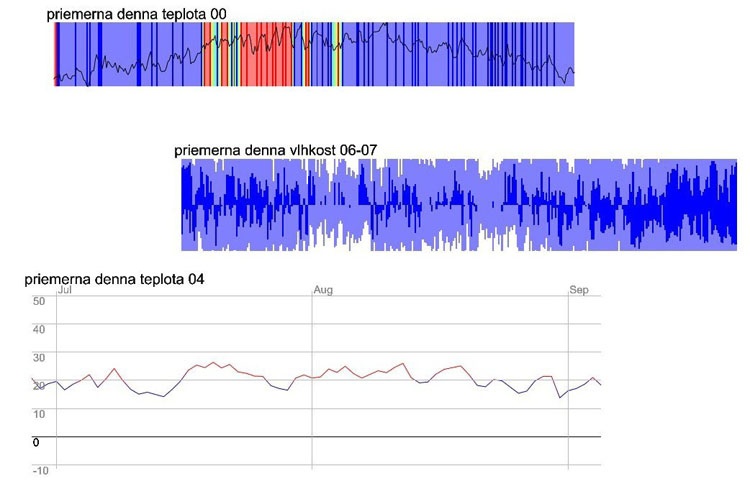
Visualization of Time-dependent Data (Martin Škorupa)
Project oriented on comparing two or more series of time-dependent data, inspired by zoologists who observe different patterns of animal behavior look for correlations with physical attributes of the environment. In our solution, two time series can be superimposed if they use different types of visualization or juxtaposed if they use the same.
Using Modern Hardware for Effective Large Data Visualization (Martin Florek)
Martin did a nice job on how current GPUs can be used to speed up rendering of information visualization displays. What different infovis displays have in commom is the use of large number of basic geometry elements (lines, dots). Not quite the target application for nowadays game-oriented GPUs. But as Martin Florek showed in his thesis (and in our SCCG 2006 poster too), reasonable improvement can be achieved if we take advantage of shaders or stencil tests.
Bachelor students
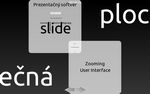
ZUI Presentation Software (Milan Lajtoš)
Milan wanted to create a presentation software facilitating the zoomable user interface (ZUI) paradigm. He adopted Ben Bederson's method and successfully defended his work... using his own presentation software.
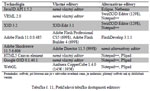
Analysis of Available Technologies for Presenting 3D Content Online (Kamil Maráz)
Kamil made a thorough survey of plugins, methods and techniques for displaying 3d content inside a webpage.
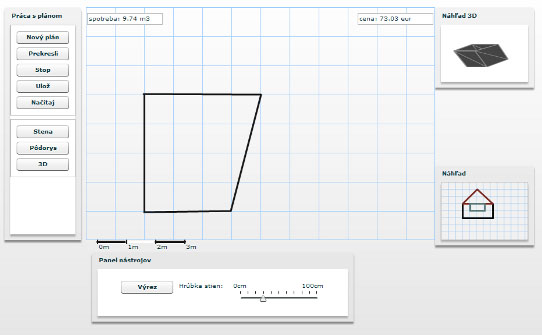
Online Planner of Construction Material (Radoslav Matúška)
Web application for rough planning of a house construction focused on computing the volume of necessary material and related costs.
Visual Analysis of Data (Eva Paľovičová)
A tiny survey of visualization types and methods, interaction means, analytic scenarios.
Content Management System for Scientific Literature (Marián Svetík)
A combination of bibliography, library and community web page. With all the bells and whistles you can imagine, including AJAX, JSON, PDF-to-text automatic export etc.

Visualization of User Statistics From Last.FM Server (Radovan Ležátka)
One of many applications that visualize your personal taste in music by using the data gathered by the last.fm service. Radovan's approach uses similarity measures obtained from the last.fm database to construct a spring model and produce a force-directed layout of the artists.
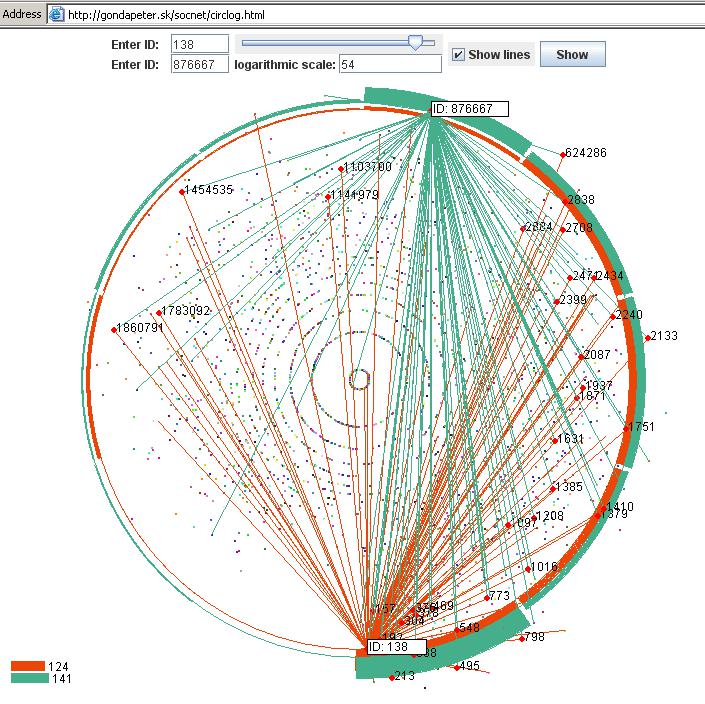
Visualization of the Social Network at Kyberia.sk (Peter Gonda)
Kyberia.sk is a community webserver for Slovak cyber-underground. Peter decided to visualize the rich network of social relationships that exist in this community. He devised original ways of displaying the complicated information together with ways of interactive visual exploration of relationships between the members.
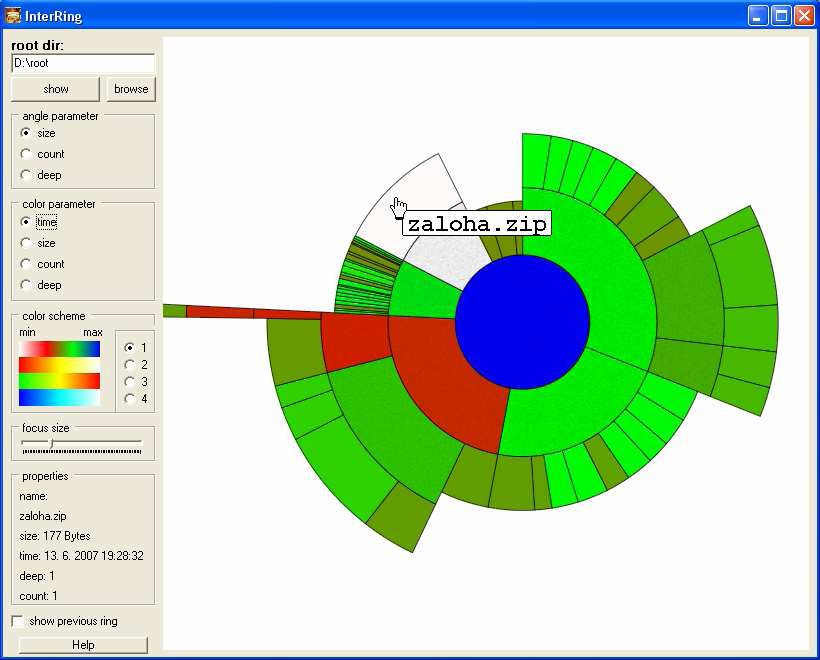
Filesystem Visualization Using InterRing (Martin Škorupa)
This project was about discussing and testing different setups of the InterRing visualization method for filesystem visualization. Various file and directory properties (size, data, depth) were mapped to various properties of the InterRing segments (width, color, texture). Then specified exploratory scenarios were applied and tested. In addition, the browsing of the directory tree employs the focus+context principles.