Matej Novotný
I'm a researcher/developer/consultant in visual computing and visualization. My professional interests are information visualization, user interfaces, visual communication. And I also enjoy teaching. I was an assistant professor at Comenius University, Faculty of Mathematics, Physics and Informatics as well as Faculty of Management.
Research
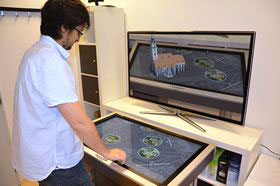
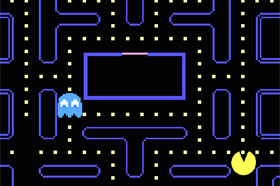
Multi-touch Augmented Reality System (MARS)
Our experiments in natural user interfaces and augmented reality.
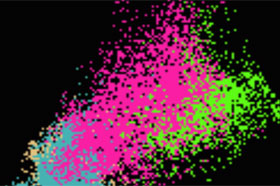
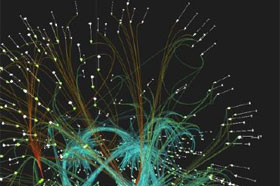
Information Visualization of Large Data
Visualization of millions of multi-dimensional data records through visual abstraction with outlier-preservation.
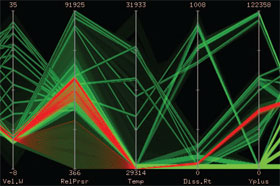
Similarity brushing
Interactive data exploration of relations through multi-dimensional data brushing and visualization.
Teaching
Graphical Systems, Visualization and Multimedia
Introduction to computer graphics.
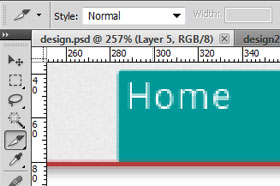
Web Graphics
Fundamentals of graphic design and web-related media.